Metrics
Overview
Note
Balto's Metrics are different than dbt's concept of Metrics used in the Semantic Layer.
Metrics provide a built-in mechanism for observing both how your data changes and how you're data pipelines are running. Metrics let you push custom metrics directly to your monitoring stack from Snowflake when executing your Balto projects.
Pushing Metrics
The Balto Orchestrator provides a built-in UDF that allows you to push custom metrics to Datadog. Combine metrics and tiggers to monitor your data in near real time.
Configuration
Before you can start pushing metrics you must create an external access integration for the Datadog api and configure a Datadog api/app key.
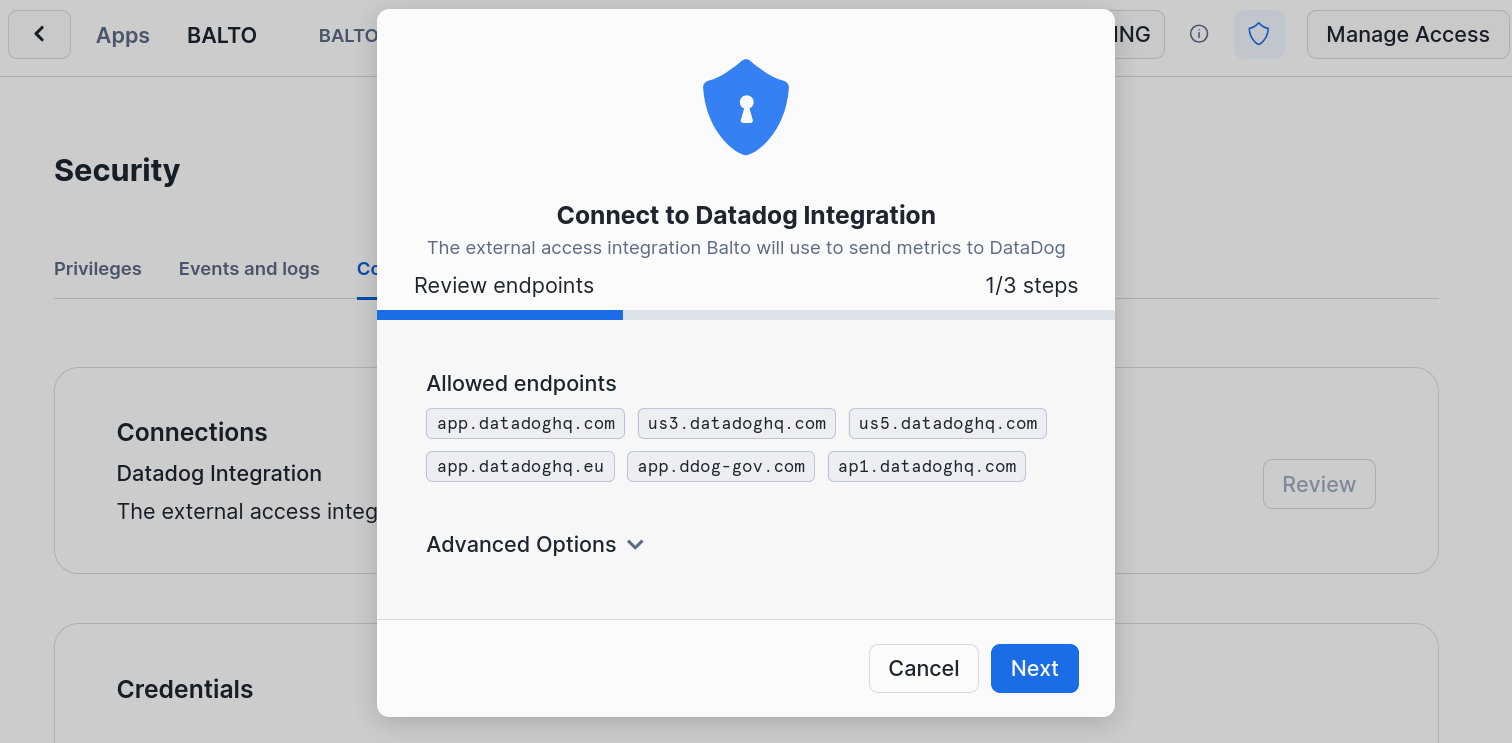
First create an api and app key through the Datadog UI. Once you have your API and application key, you can setup an external integration for Datadog through the security pane of the Balto App:

Once you've created the external integration call the balto.config.setup_datadog with your Datadog URL as the only argument to create the stored procedures Balto uses for interacting with Datadog:
1 | |
You should now be able to use the built-in balto.dbt.metric_handler procedure when defining your triggers.
Limitations
Balto currently only supports Datadog as a metric endpoint.